Most of your restaurant bill pays for things you cannot eat.
Someone cooking, serving and washing up. Rent. Card fees. Those things have value. But a bigger bill does not mean better ingredients, and the food on your plate may have come off the same truck as the place down the street.
From October 2016 to October 2026, the Bureau of Labor Statistics' food-away-from-home index rose 51.6%. Groceries rose 35.6%. Prices overall rose 39.6%.
Food away from home includes restaurants and takeout, but also school lunches, vending and other foodservice. It is a broad price measure, not a verdict on your neighborhood diner.
Still, the gap deserves a look before dinner out becomes a bill you pay on autopilot.
Key takeaways
- Full-service restaurant food costs run around a third of sales. Labor costs more.
- Major distributors sell both ingredients and prepared dishes. That does not tell you what a particular restaurant makes.
- Tipflation means more places asking, on higher bills. Tip percentages are roughly flat.
- Grocery downsizing is measured. Claims about shrinking restaurant plates are not.
The Gap Started Before the Pandemic
Here are the BLS changes over matching October observations:
| Period | Food away from home | Groceries | All prices |
|---|---|---|---|
| 2016–2026 | +51.6% | +35.6% | +39.6% |
| 2021–2026 | +27.8% | +21.6% | +22.0% |
Over the longer period, food away from home beat groceries by 16 percentage points. That is a difference between growth rates, not a claim that restaurant meals cost only that much more than groceries.
The split predates pandemic disruption. From October 2016 to October 2019, food away from home rose 8.4%, against 1.8% for groceries.
It did not win every year. Grocery prices jumped faster in 2022. But the latest available annual comparison, September 2025 to September 2026, puts food away from home up 3.5% and groceries up 1.8%.
Why September? BLS did not collect October 2025 CPI data. There is no valid October-to-October annual comparison for 2026.
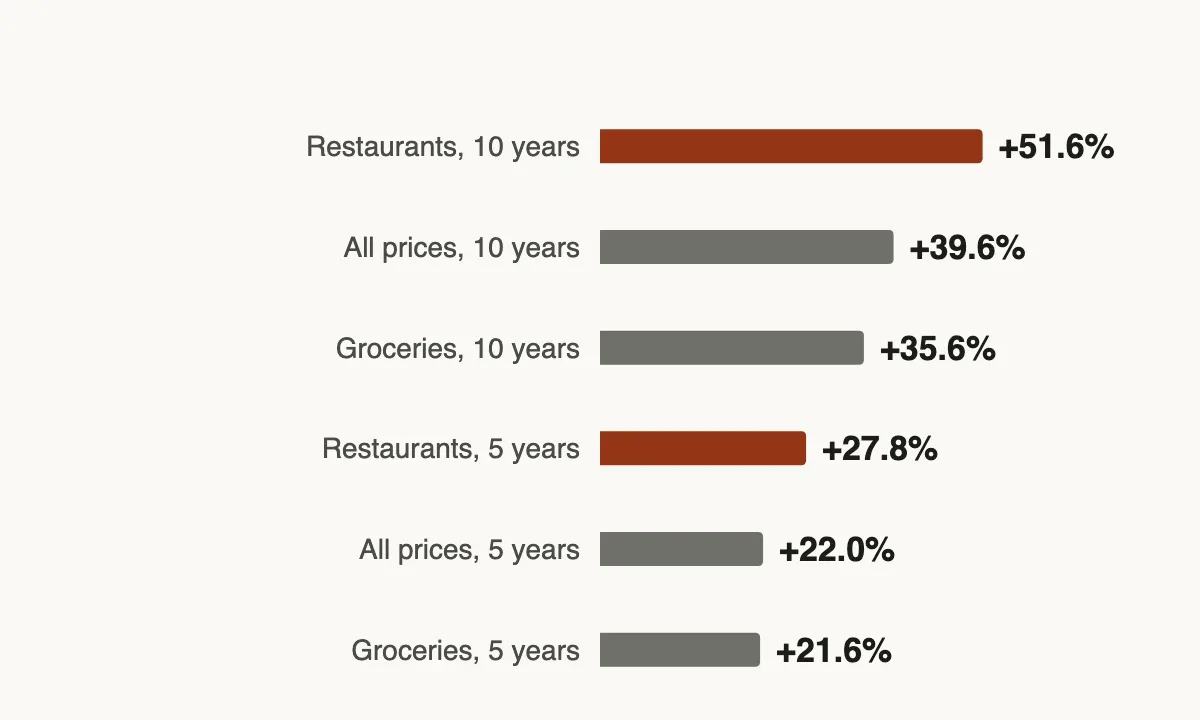
Source: BLS CPI-U, U.S. city average, not seasonally adjusted. Percent change in each index over matching October periods. Food away from home includes more than restaurants.
Where Your $20 Entrée Goes
The National Restaurant Association's 2025 operations report, using 2024 results, puts full-service median food and nonalcoholic beverage costs at 32% of sales. Wages and benefits took 36.5%. Median income before taxes was 2.8%.
Apply those shares to an illustrative $20 entrée:
| What it pays for | Dollars |
|---|---|
| Food and nonalcoholic beverages | $6.40 |
| Wages and benefits | $7.30 |
| Other costs, calculated as the remainder | $5.74 |
| Income before taxes | $0.56 |
These are separate survey medians combined for illustration. They are not the accounts of an actual restaurant. The remainder stands in for rent, utilities, supplies, payment fees and other costs.
The restaurant does not pocket everything above the ingredient bill. But you do pay it. A dining room and staff can be worth the money; they do not make the food itself more expensive to buy at home.
There is a good reason a cooked meal costs more than its ingredients. Somebody has to turn them into dinner, carry the risk of unsold food and keep the place running between customers. Understanding that cost does not oblige you to buy the service every time you are hungry.
Using BLS national average ingredient prices for October 2026, a cheeseburger-and-oven-fries dinner for four comes to about $16.68. Chicken, rice and salad come to about $13.34.
Those are ingredient illustrations, not complete household costs. They exclude oil, condiments, seasoning, cooking energy and your time. The burger basket uses white bread as a bun proxy. Your store and portions will differ.
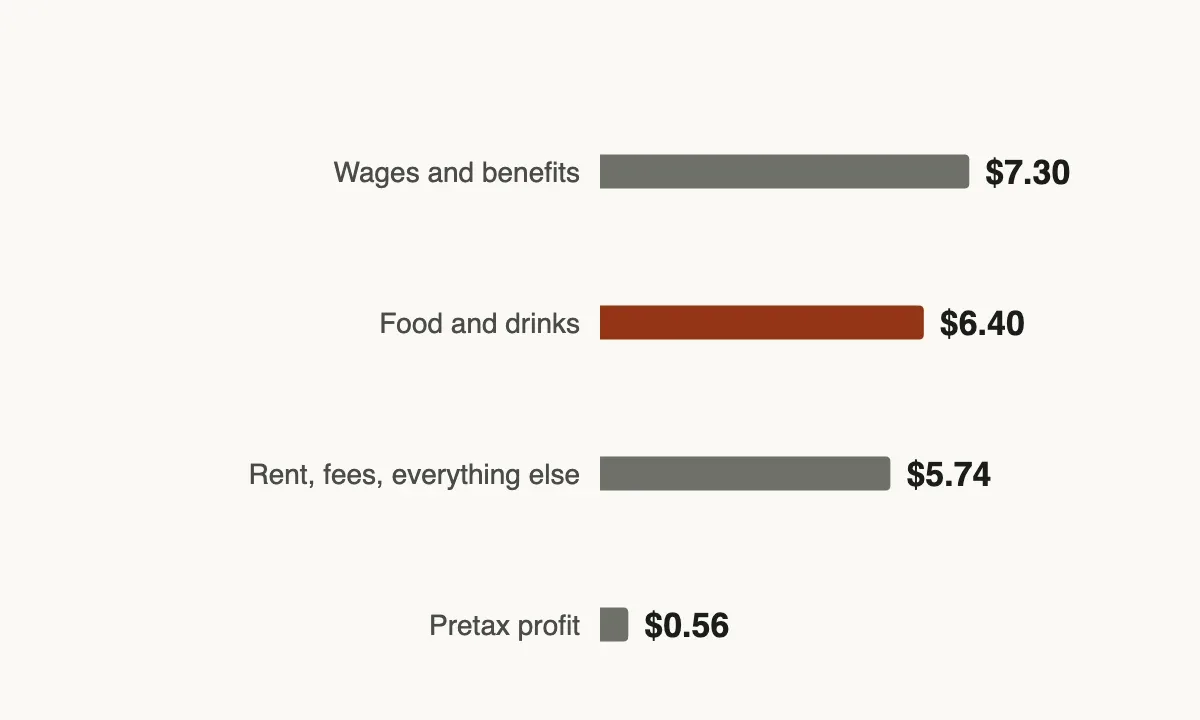
Source: National Restaurant Association, 2025 Restaurant Operations Data Abstract, full-service medians for 2024. Combined medians are illustrative; other costs are the residual, not a measured category total.
Different Signs, Familiar Suppliers
Sysco reported $84.6 billion in fiscal 2026 sales. Performance Food Group reported $67.8 billion that fiscal year. US Foods reported $39.4 billion for fiscal 2025.
The customer networks are enormous: roughly 670,000 locations globally for Sysco, over 350,000 for PFG and about 250,000 for US Foods. These are each company's reported reach, not unique locations you can add together.
Do not add the sales into a supposed restaurant market share, either. The fiscal years differ. PFG's total includes about $26 billion in convenience distribution. Sysco's business extends outside the country.
Sysco estimates its own share at 17.6% of a $377 billion U.S. foodservice addressable market in 2025. That is a company-supplied estimate using industry research, not a government count.
Then there is the famous 75% figure. In 2015, the FTC said a combined Sysco and US Foods would hold that share of national broadline distribution services: the narrower market serving customers needing nationwide distribution. It did not mean all restaurant food. The deal was blocked and abandoned. The companies never combined. This was a merger challenge, not a finding of price fixing.
What do the trucks carry? Ingredients, certainly. Sysco's 2018 annual filing also lists fully prepared entrées. Its dessert catalog advertises frozen, thaw-and-serve slices that save operators labor.
That proves the products exist. It does not prove any named restaurant serves them, or establish what share of restaurant dishes arrives prepared. Distributors supply hospitals, schools and hotels, too; restaurants accounted for 59% of Sysco's fiscal 2026 sales.
Ask what a kitchen makes on-site. A high menu price cannot answer that for you.
Tipflation Does Not Need a Higher Percentage
Pew's 2023 survey found 72% of Americans said tipping was expected in more places than five years earlier. 40% opposed businesses suggesting tip amounts. 72% opposed automatic service charges.
The pressure is real. A nationwide surge in tip percentages is a different claim.
Square's quarterly release reported food-and-beverage tip averages of 14.85% in the third quarter of 2025, 14.93% in the fourth and 14.99% in the first quarter of 2026. That is roughly flat. It describes Square's data, not every American payment.
Square separately reported 17.7% for October 2026, measured only when a tip was left, on the pretax subtotal. The quarterly release does not specify the same method. Those numbers cannot be joined into a rising trend.
You do not need a rising rate to spend more. Keep tipping 20% while the underlying bill rises 51.6%, and the tip dollars rise 51.6%, too. Then add more counters asking.
The Labor Department says the federal cash-wage floor for eligible tipped employees is $2.13 an hour, with a maximum $5.12 tip credit toward the $7.25 federal minimum. Employers must cover any shortfall. Many states require higher cash wages. A mandatory service charge is not a tip under federal law.
Fee rules differ, too. California's SB 478, amended by SB 1524, permits qualifying restaurant mandatory fees to remain separate if clearly disclosed wherever prices appear, according to the state attorney general. The FTC fee rule effective in May 2025 covers live-event tickets and short-term lodging, not restaurants.
Less for Your Money Is Not Proof of Smaller Plates
Grocery shrinkflation is measurable. BLS illustrates it with ice cream: 64 ounces become 60, still priced at $5.99. The effective unit price rises 6.7%. The shelf sticker can stay put while the value falls.
Keep the scale honest. GAO found downsizing contributed less than 0.1 percentage point of the 34.5% overall consumer-price increase from 2019 through 2024. Real at the package level; a small part of total inflation.
Restaurant portions are another question. Diners remembering smaller plates are reporting perceptions, not weighing matched meals over time.
A survey by Datassential and food-waste nonprofit ReFED cuts the other way. It asked 1,509 U.S. consumers about portions in August 2025. Nearly half had recently been surprised by a meal's large size. 30% wished a meal had been smaller. That does not establish a portion trend, either.
Higher prices are easier to document. McDonald's own 2024 pricing statement put its average Big Mac at $5.29, against $4.39 in 2019: about 21% higher. It put the meal at $9.29, up from $7.29, or 27%. Average menu prices were up around 40%, the company said. Franchisees set local prices.
You can get less value without a smaller plate. When sauces, sides or service carry separate charges, the advertised entrée price buys less of the complete experience. Check what is included instead of assuming the plate shrank.
The Dinner-for-Four Math
Build an example, not a national average check: two $18 adult entrées and two $10 children's meals. Food totals $56. Assume 7.53% tax and a 20% pretax tip. No drinks, appetizers or extra fees.
$56 food + $4.22 tax + $11.20 tip = $71.42.
The tax rate is an illustrative input based on a reported Tax Foundation combined-rate estimate. Your local restaurant tax may differ. The menu prices are assumptions, not surveyed averages.
Against about $16.68 for the home burger basket, the weekly gap is roughly $55. Repeat that choice 52 times and the difference is about $2,846 a year. That is a vacation, paid for one burger night at a time.
Change the assumed food check to $40 or $80, keeping the tax and tip assumptions, and the annual gap ranges from roughly $1,785 to $4,438.
The $11.20 tip alone is about two-thirds of the entire burger basket's ingredient cost. That is how expensive outsourcing dinner can be, even before ordering a drink.
The home basket is a cost of ingredients consumed, not necessarily the cash you hand over at checkout. You may buy a larger package and keep the rest. Nor is the difference pure savings if you throw the remaining food away. Use the example to price your own habit, including the work you are willing to do.
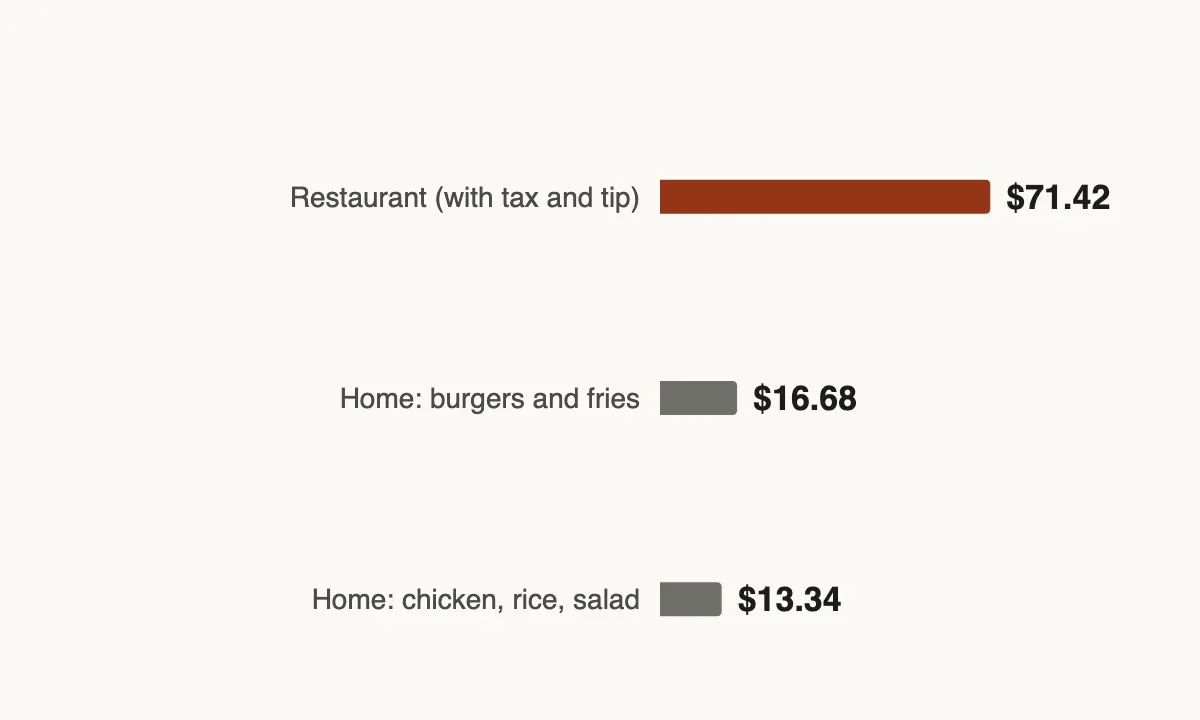
Sources: BLS October 2026 average ingredient prices; illustrative restaurant assumptions above. Restaurant: $71.42. Home burgers: $16.68. Home chicken: $13.34. At one dinner weekly, annual totals are approximately $3,714, $867 and $694. Home bars exclude pantry extras, energy and time.
Buy the Evening You Actually Want
Some dinners out earn their price. You want company, a particular kitchen, a break from dishes or a meal you would not bother making. Buy that deliberately.
The expensive habit is paying for the whole service package when all you wanted was something to eat.
Ask which dishes are made on-site. Check whether sides and sauces are included. Read mandatory charges before ordering, and ask how a service charge relates to the gratuity. If you calculate a tip on the pretax subtotal, check the screen's arithmetic rather than trusting its suggestion.
Save restaurant money for meals and evenings you value. Put an ordinary dinner back in your own kitchen when the convenience stops justifying the bill.
And here's the part restaurants don't advertise: cooking at home can taste better with surprisingly little work. That's the next article.
More of the same pattern: the daily coffee habit, premium gas your car can't use and the extended warranty at checkout.
Sources
- BLS food-away-from-home CPI series: https://api.bls.gov/publicAPI/v2/timeseries/data/CUUR0000SEFV
- BLS grocery CPI series: https://api.bls.gov/publicAPI/v2/timeseries/data/CUUR0000SAF11
- BLS all-items CPI series: https://api.bls.gov/publicAPI/v2/timeseries/data/CUUR0000SA0
- BLS October 2026 CPI release and missing October 2025 comparison: https://www.bls.gov/news.release/archives/cpi_11102026.htm
- National Restaurant Association, food-cost medians: https://restaurant.org/research-and-media/research/restaurant-economic-insights/analysis-commentary/restaurant-operators-kept-food-cost-ratios-in-check-in-2024/
- National Restaurant Association, labor and pretax-income medians: https://restaurant.org/research-and-media/media/press-releases/new-resource-from-national-restaurant-association-provides-insights-into-operational-realities
- BLS average-price data, ground beef: https://api.bls.gov/publicAPI/v2/timeseries/data/APU0000703112
- BLS average-price item directory for the ingredient baskets: https://download.bls.gov/pub/time.series/ap/ap.item
- Sysco fiscal 2026 results: https://investors.sysco.com/~/media/Files/S/Sysco-IR/documents/quarterly-results/syy-press-release-fy26-q4.pdf
- Sysco sales by customer type: https://investors.sysco.com/~/media/Files/S/Sysco-IR/documents/quarterly-results/q4-fy26-at-a-glance.pdf
- US Foods fiscal 2025 annual report, mirrored filing: https://www.marketscreener.com/news/us-foods-annual-report-for-fiscal-year-ending-12-27-2025-form-10-k-ce7e5ad3dc8aff27
- Performance Food Group fiscal 2026 results: https://s22.q4cdn.com/140600076/files/doc_financials/2026/q4/Performance-Food-Group-Company-Reports-Fourth-Quarter-and-Full-Year-Fiscal-2026-Results.pdf
- Sysco's market-share estimate: https://investors.sysco.com/~/media/Files/S/Sysco-IR/documents/events-and-presentations/syy-cagny-2026-02-16-26.pdf
- FTC challenge to the proposed Sysco–US Foods merger: https://www.ftc.gov/news-events/news/press-releases/2015/02/ftc-challenges-proposed-merger-sysco-us-foods
- FTC case closure after the deal was abandoned: https://www.ftc.gov/news-events/news/press-releases/2015/07/following-syscos-abandonment-proposed-merger-us-foods-ftc-closes-case
- Sysco's historical prepared-food product description: https://www.sec.gov/Archives/edgar/data/96021/000009602118000126/syy2018q410-k.htm
- Sysco thaw-and-serve dessert catalog: https://foodie.sysco.com/cutting-edge-solutions/sysco-imperial-dessert-mashups/
- Pew Research Center, tipping attitudes: https://www.pewresearch.org/2023/11/09/tipping-culture-in-america-public-sees-a-changed-landscape/
- Square quarterly tipping figures: https://squareup.com/us/en/press/food-beverage-q1-2026-data
- Square Insights, October 2026 tipped-transaction measure: https://squareup.com/us/en/insights
- U.S. Department of Labor, tipped wages and service charges: https://www.dol.gov/agencies/whd/fact-sheets/15-tipped-employees-flsa
- California attorney general, fee-disclosure rules and restaurant exception: https://www.oag.ca.gov/hiddenfees
- FTC, scope of its fee rule: https://www.ftc.gov/news-events/news/press-releases/2025/05/ftc-rule-unfair-or-deceptive-fees-take-effect-may-12-2025
- BLS, measuring package shrinkflation: https://www.bls.gov/opub/btn/volume-12/measuring-shrinkflation-and-its-impact-on-inflation.htm
- GAO, downsizing's contribution to inflation: https://www.gao.gov/products/GAO-25-107451
- Datassential/ReFED, restaurant portion-size survey: https://refed.org/downloads/Datassential-ReFED-Restaurant-Portion-Size-Study-2025.pdf
- McDonald's 2024 letter, company price figures and franchisee pricing: https://corporate.mcdonalds.com/corpmcd/our-stories/article/providing-meaningful-value-to-our-fans-with-a-side-of-facts.html
- McDonald's accompanying 2024 pricing fact sheet: https://corporate.mcdonalds.com/content/dam/sites/corp/nfl/pdf/McDUS%20Pricing%20Myths%20vs%20Facts%20052924.pdf
- Tax Foundation, combined sales-tax estimate referenced in the illustrative model: https://taxfoundation.org/data/all/state/2026-sales-tax-rates-midyear/